
Easy access to essential information boosts my productivity, so I decided to create a small dashboard for my desk. That idea gradually turned into a project with an e-ink display and a Raspberry Pi.
If you are a programmer with even basic knowledge of Unix and Python scripts (no hardware knowledge required), this blog post series is for you. I will present my journey, from setting up the hardware and configuring the environment to writing the script that displays the data on the e-ink screen. This blog post is not going to replace official documentation or guides - rather, extend it with a practical example. We will connect an e-ink display to a Raspberry Pi and display a clock running as a system service. In the next posts, we will tackle more advanced topics: testing, partial refreshing, and displaying data from external APIs.
Part 1: Hardware setup and first clock
Part 2: Refresh strategy, testing and logging
Part 3: External API integration
E-ink displays are fun
Compared to a traditional LCD display, an E-ink display is very energy efficient, does not strain the eyes, and has decent visibility under various angles. It’s perfect for reading books, but also for product labels and information display. And every year it’s getting cheaper, while providing a better display quality. On the other hand, it has a low refresh rate (in seconds or in minutes) and is pretty limited with colors (at least for now). So, it’s bad for displaying a movie, but great for showing static data that doesn’t change often. It’s a great fit for small, always-on dashboards that show useful information. Let’s build one!
This is the final-ish goal:
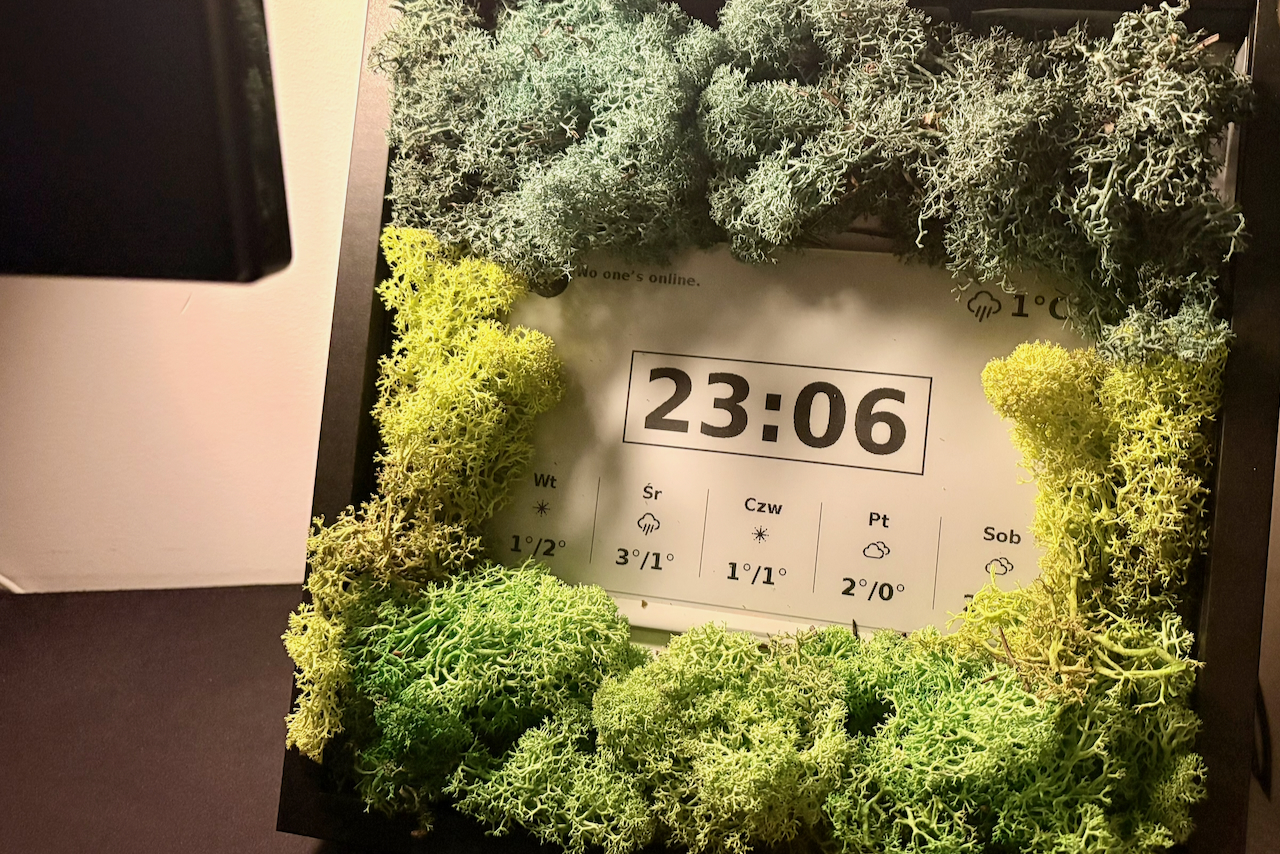
A dashboard that displays the time, current weather, weather forecast, and some extra data (for example, the list of PRs to review from GitHub). In this post, we will implement only the clock; other widgets will come later.
Initial Setup
Let’s start with the hardware we are going to use:
- Waveshare 7.5-inch e-ink V2 with HAT (link)
- Raspberry Pi 4
ℹ️ This tutorial covers Waveshare e-ink displays; for other brands, there might be differences in handling drivers and installation.
I’m using Raspberry Pi OS, but other Linux distributions should work as well - just make sure you have SPI pins to connect the display. Even though the instructions I present are based on this specific hardware, it should work on any Waveshare e-ink display and Linux-based computer.
To connect the display with Raspberry, follow the steps:
- enable SPI
- turn off the Raspberry
- plug the HAT into the pins
- turn the Raspberry on.
When this is ready, we can move to the fun part: programming.
Waveshare drivers installation
The e-ink display is controlled with dedicated software that can be downloaded from the Waveshare GitHub repo. The repo is slightly chaotic and contains example code for many display models; make sure you pick the directory matching your display. The first step is to recognise your model and version. I have a 7.5” V2 display, so the dir I’m using is epd_7in5_V2.
You can choose a C or Python implementation. I’ve already got Python installed on my Raspberry Pi, so examples below use Python 3.
Install the required libraries with:
sudo apt update
sudo apt install python3-pip python3-pil python3-numpy
Then, download the Waveshare repository and run the test script:
git clone https://github.com/waveshareteam/e-Paper.git
cd e-Paper/RaspberryPi_JetsonNano/python/examples
python3 epd_7in5_V2_test.py
If you see the eink screen flashing and displaying test data, you can proceed to the next step. Otherwise, address the problem. Various things can require fixing, so here’s a simple checklist to validate:
- e-ink display cables are properly connected to the Raspberry Pi
- Python is installed and executable
- Linux user has permissions to run commands (eg, with
sudo)
Once the test script works, you have everything you need to start building your own dashboard.
The clock
The feature we start with is a simple clock. Even in this trivial scenario, there are some challenges to overcome. Eventually, the system is composed of the following parts:
- Rendering: a function that draws the clock on the screen
- Executing: a runner that executes the function periodically (every minute)
To display anything on the e-ink screen, we first need to render it into an image. For that, we’ll use PIL (Python Imaging Library). I won’t go deep into library details here - we’ll keep it simple and just draw the current time inside a box with solid borders.
First, let’s create a clock.py file and make imports:
import sys
import os
# Waveshare library paths
picdir = os.path.join(os.path.dirname(os.path.dirname(os.path.realpath(__file__))), 'pic')
libdir = os.path.join(os.path.dirname(os.path.dirname(os.path.realpath(__file__))), 'lib')
if os.path.exists(libdir):
    sys.path.append(libdir)

from waveshare_epd import epd7in5_V2
from PIL import Image, ImageDraw, ImageFont
from datetime import datetime, timedelta
import time
Then, define the function to display the actual time:
def draw_date_and_time(full_width, full_height, font):
    font_big = ImageFont.truetype(font, 120)

    image = Image.new('1', (full_width, full_height), 255)
    draw = ImageDraw.Draw(image)

    now = datetime.now()
    time_str = now.strftime("%H:%M")

    # --- Time ---
    bbox = draw.textbbox((0, 0), time_str, font=font_big)
    w, h = bbox[2] - bbox[0], bbox[3] - bbox[1]
    time_x = (full_width - w) // 2
    time_y = (full_height - h) // 2 - 50

    # Draw border around time (with padding)
    border_padding = 20
    border_x1 = time_x - border_padding
    border_y1 = time_y + bbox[1] - border_padding  # Use bbox top offset
    border_x2 = time_x + w + border_padding
    border_y2 = time_y + bbox[3] + border_padding  # Use bbox bottom offset
    draw.rectangle([border_x1, border_y1, border_x2, border_y2], outline=0, width=3)

    draw.text((time_x, time_y), time_str, font=font_big, fill=0)

    return image
When we have it, we can use it inside the final script (clock.py file):
def run_clock():
    epd = epd7in5_V2.EPD()
    font = '/usr/share/fonts/truetype/dejavu/DejaVuSans-Bold.ttf'

    epd.init()
    epd.Clear()
    epd.sleep()

    try:
        while True:
            image = draw_date_and_time(epd.width, epd.height, font)
            epd.init_fast()
            epd.display(epd.getbuffer(image))
            epd.sleep()
            time.sleep(60)  # 1 minute

    except KeyboardInterrupt:
        epd.init()
        epd.Clear()
        epd.sleep()
    except Exception as e:
        epd.init()
        epd.Clear()
        epd.sleep()

if __name__ == "__main__":
    run_clock()
⚠️ Panel safety: notice the epd.sleep() calls around every refresh. Waveshare warns that keeping the panel powered continuously can damage it permanently, so we put it to sleep between updates. This is already the bare minimum; in Part 2, we’ll go further with partial refreshes and nightly blanking.
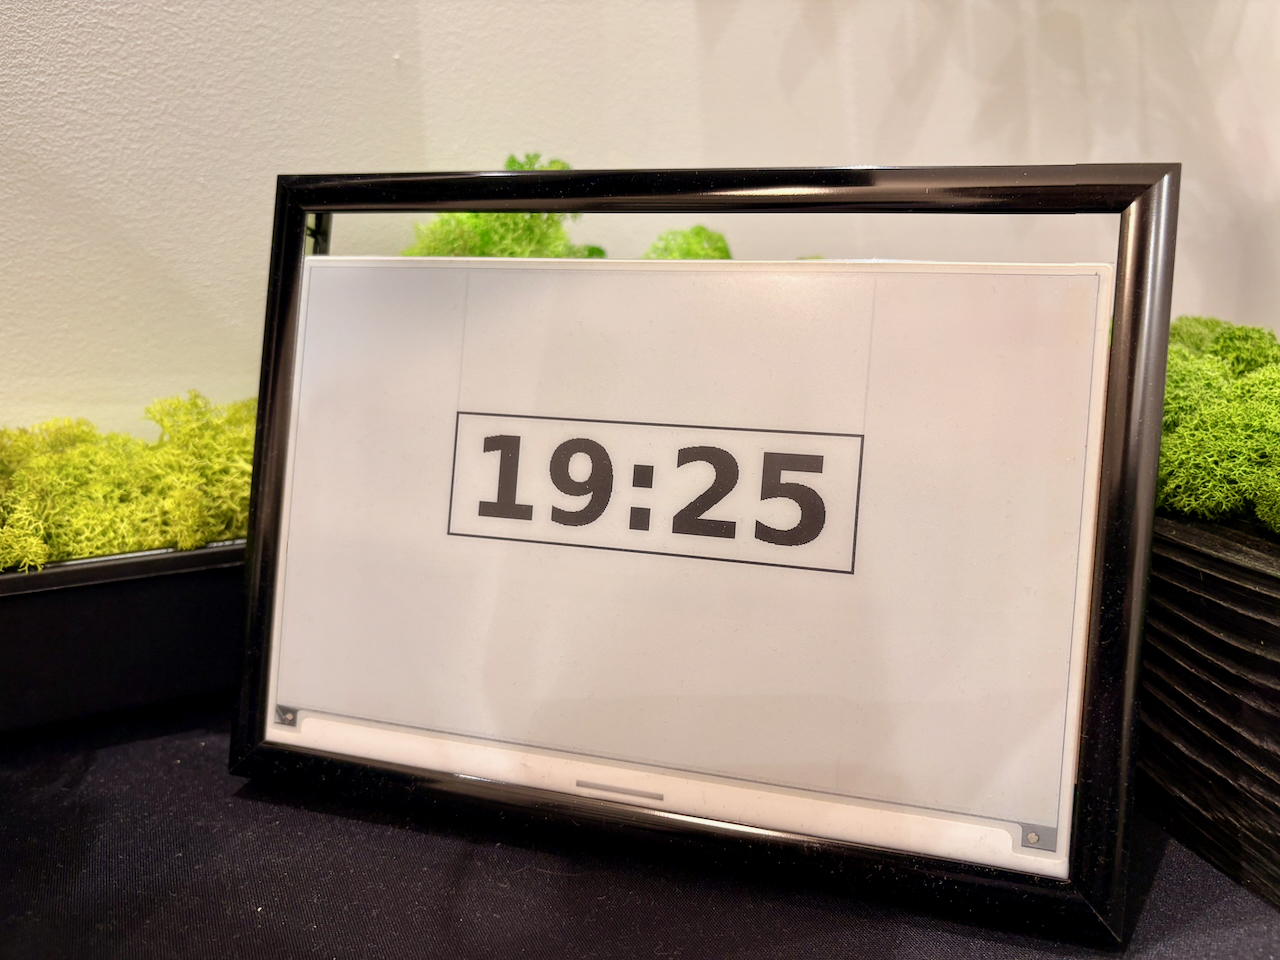
And we can test the script with: python3 clock.py. It should display the clock.
We just learned how to draw on the e-ink display!
You can check out the full script in this GitHub Gist. The complete project is also available in the waveshare-eink repo - the 1.0 tag matches the state described in this series.
Runner service
Now we can add the second element: the runner. We can manually invoke the function and see the result on the screen immediately, but eventually, we want a system process to run it every minute. Let’s use systemctl, a built-in Unix tool for such a purpose.
We need to:
- create service file
- start and enable the service
1. Create the service file /etc/systemd/system/eink-clock.service:
[Unit]
Description=E-Ink Clock Service
After=network.target

[Service]
ExecStart=/usr/bin/python3 /home/pi/eink/clock.py
WorkingDirectory=/home/pi/eink
User=pi
Restart=on-failure
RestartSec=10s
StartLimitIntervalSec=300
StartLimitBurst=5

[Install]
WantedBy=multi-user.target
The most important parts:
- Restart logic: on failure, we try to restart the service 5 times
- We use the default Raspberry Pi user called
pito execute the script (adjust if needed) - There is a path to the script
/home/pi/eink/clock.py- modify it according to your file location.
2. Start the service
When the file is ready, enable the service with the command: sudo systemctl enable eink-clock.service
Then, we can start it with sudo systemctl start eink-clock.service and check its status with sudo systemctl status eink-clock.service.
Running the service should display the clock and update it every minute.
Congratulations! 🎉
We’ve successfully connected the display, we control the content of it, and update it periodically! For now we display a simple clock, but the possibilities are endless! In Part 2, we’ll improve refresh behavior so updating the clock doesn’t flash the entire screen. Also, we will figure out how to test the script to make it more reliable.