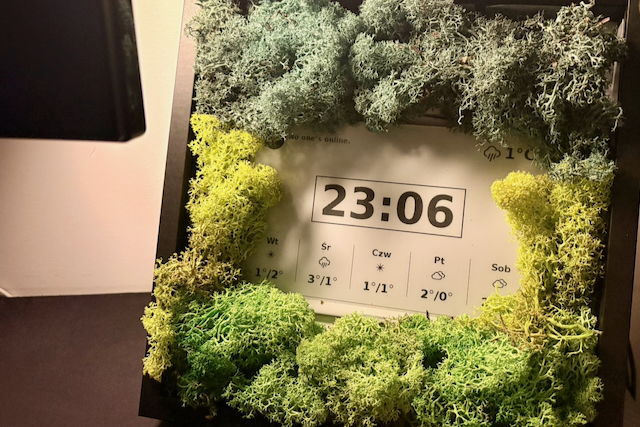
This is Part 2 of the e-ink dashboard tutorial. We’ll switch the clock to partial refresh to stop the screen flashing, and improve the development workflow with local testing and logging. In Part 1, we set up the hardware, installed drivers, and built a simple digital clock running as a background service. If you’ve run it, you’ve probably noticed the screen flashing every minute - that’s what we’ll address first.
Part 1: Hardware setup and first clock
Part 2: Refresh strategy, testing and logging
Part 3: External API integration
Full refresh vs partial refresh
If you’ve already run the clock from Part 1, you’ve probably noticed the entire screen flashing every minute. The whole screen is redrawn, which is distracting and slow.
This is because we are using full refresh mode: wiping the whole screen and drawing everything from scratch. This type of refresh is noticeable but prevents ghosting - displaying remains of the previous content of the screen. However, in some cases, we could use a more efficient way of refreshing: partial refresh. As the name suggests, it updates only some parts of the screen, which makes it faster and less disturbing. Very useful for small updates, such as a clock. It has some limitations, though: not every display supports it, and it accumulates ghosting, so full refresh is required occasionally.
When to use which refreshing type?
- small, frequent updates -> partial refresh + periodical full refresh
- large layout changes -> full refresh
Let’s update our script to use partial refresh for clock updates mixed with full refresh every N minutes. First, we need to initialize display in fast mode with epd.init_fast function (instead of epd.init), and then call epd.display_Partial for updating only part of the screen.
⚠️ As you can read in Waveshare documentation:
For e-Paper displays that support partial refresh, please note that you cannot refresh them with the partial refresh mode all the time. After refreshing partially several times, you need to fully refresh EPD once. Otherwise, the display effect will be abnormal, which cannot be repaired!
To address aforementioned issues, we will:
- Call
epd.sleep()after every refresh. Waveshare explicitly warns that keeping the panel powered for long periods can damage it permanently, so we put it to sleep between updates and wake it up for the next one. - Count partial refreshes. Waveshare says you must do a full refresh “after refreshing partially several times”, so let’s keep the count ≤ 5.
FULL_REFRESH_EVERY = 5  # partial refreshes between full refreshes

def run_clock():
    epd = epd7in5_V2.EPD()

    epd.init()
    epd.Clear()
    epd.sleep()

    partials_since_full = FULL_REFRESH_EVERY  # force full refresh on first draw

    try:
        while True:
            image = drawing.draw_date_and_time(epd.width, epd.height, font)
            buf = epd.getbuffer(image)

            if partials_since_full >= FULL_REFRESH_EVERY:
                epd.init_fast()
                epd.display(buf)
                partials_since_full = 0
            else:
                epd.init_fast()
                epd.display_Partial(buf, 0, 0, epd.width, epd.height)
                partials_since_full += 1

            epd.sleep()
            time.sleep(60)

    except Exception as e:
        epd.init()
        epd.Clear()
        epd.sleep()
Not every e-ink panel supports partial refresh, so always check your model’s documentation. If you’re afraid of using partial refresh, start conservatively (more frequent full refreshes) and adjust later.
Night mode
Waveshare recommends against keeping any static image on the panel for a long time - leaving the same frame up for hours can cause burn-in. We also don’t really need the clock between midnight and the morning. A few extra lines give us both a longer panel life and a few thousand fewer refreshes per year:
NIGHT_START_HOUR = 0  # 00:00 inclusive
NIGHT_END_HOUR = 7    # 07:00 exclusive

def is_night(now):
    return NIGHT_START_HOUR <= now.hour < NIGHT_END_HOUR
Then, at the top of the loop, short-circuit to a cleared and sleeping panel during night hours:
if is_night(datetime.now()):
    if not sleeping_for_night:
        epd.init()
        epd.Clear()
        epd.sleep()
        sleeping_for_night = True
    time.sleep(60)
    continue

if sleeping_for_night:
    sleeping_for_night = False
    partials_since_full = FULL_REFRESH_EVERY  # force full refresh on wake
The sleeping_for_night flag prevents us from redrawing the panel every minute while it should stay blank.
Testing
Let’s say we want to add a new piece of information to display on the screen. We have a clock, let’s also add the current date. Sounds very easy, probably just a few lines of code in the function displaying time. But how do we test it? We need to stop the service with systemctl, manually execute the script, see the result on the screen, apply fixes if needed… and repeat this loop until we are happy. I came up with a more programmer-friendly flow: decoupling rendering from hardware.
def draw_date_and_time(full_width, full_height, font):
    font_big = ImageFont.truetype(font, 120)

    image = Image.new('1', (full_width, full_height), 255)
    draw = ImageDraw.Draw(image)

    now = datetime.now()
    time_str = now.strftime("%H:%M")

    # --- Time ---
    bbox = draw.textbbox((0, 0), time_str, font=font_big)
    w, h = bbox[2] - bbox[0], bbox[3] - bbox[1]
    time_x = (full_width - w) // 2
    time_y = (full_height - h) // 2 - 50

    # Draw border around time (with padding)
    border_padding = 20
    border_x1 = time_x - border_padding
    border_y1 = time_y + bbox[1] - border_padding  # Use bbox top offset
    border_x2 = time_x + w + border_padding
    border_y2 = time_y + bbox[3] + border_padding  # Use bbox bottom offset
    draw.rectangle([border_x1, border_y1, border_x2, border_y2], outline=0, width=3)

    # TODO: add date

    draw.text((time_x, time_y), time_str, font=font_big, fill=0)

    return image
Because our drawing function returns a PIL image, we can test it without any e-ink hardware. Let’s create a script that simply renders it! This way, we can develop it independently: write the code in your favorite IDE, test locally, and then push to the Raspberry Pi and execute for the final test.
Here’s the test script:
# demo.py
from PIL import Image, ImageDraw, ImageFont
from datetime import datetime, timedelta
import drawing

WIDTH, HEIGHT = 800, 480  # 7.5" screen size, adjust to your model

def draw_demo():
    # use any font available on your system
    font = "/System/Library/Fonts/Supplemental/Arial Bold.ttf"
    image = drawing.draw_date_and_time(WIDTH, HEIGHT, font)

    image.show()
    image.save("preview.png")


draw_demo()
Run it with python demo.py and you will see the image:
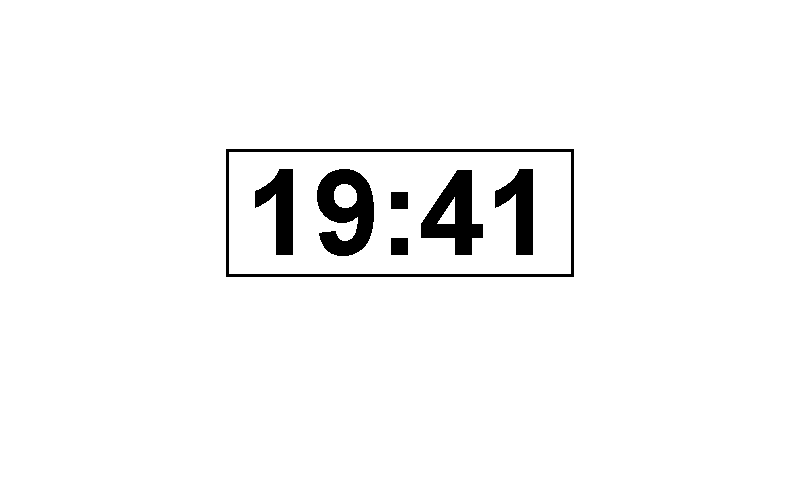 This makes iteration much faster: you can adjust results locally and deploy to Raspberry Pi once you’re happy. It will be very handy when we add more features to our dashboard later on.
Logs
A testing script greatly improves development flow, but does not prevent occasional problems. Sometimes the screen won’t update, and without logs, it’s hard to tell why. There might be issues with loading files, using system fonts, or just a typo in the part of the script that can’t be easily tested. If we can’t prevent all problems, let’s make them easier to debug by adding logs.
First, we need to import logging module and set up the format of log messages with:
# import logging module
import logging

# directory for log file: /eink/logs/clock.log
# feel free to adjust this path
OUT_DIR = os.path.expanduser('~/eink/logs')
os.makedirs(OUT_DIR, exist_ok=True)
LOG_FILE = os.path.join(OUT_DIR, 'clock.log')

# format of logs: 12:34:56 INFO: message
logging.basicConfig(level=logging.DEBUG,
                    format='%(asctime)s %(levelname)s: %(message)s',
                    datefmt='%H:%M:%S',
                    handlers=[
                        logging.FileHandler(LOG_FILE), # log file
                        logging.StreamHandler(sys.stdout) # stdout
                    ]
                    )
We use both FileHandler and StreamHandler, so logs are saved into the file and also to stdout, making them visible in systemctl status command.
Then, in every meaningful place we can run:
logging.info("Initializing E-Ink clock")
# (..)
logging.info("Partial refresh")
# (..)
except Exception as e:
        logging.error("Fatal error occurred: %s", e, exc_info=True)
When something breaks, you can inspect logs with systemctl status or check the logs file for more information.
You can find full code examples in the GitHub Gist or in the complete waveshare-eink repo.
Congratulations! 🎉
Our dashboard is now faster, more stable and easier to debug. We use partial refresh to avoid flashing and we made the development smoother with tests and logs. Now we are ready to turn our screen into a real dashboard: fetching and displaying live data from external APIs, such as the weather forecast. That’s exactly what we’ll see in Part 3.