This is the final part of the e-ink dashboard tutorial. After successful setup, testing and knowing the refresh strategy options, now the most fun part - integration with the external API! This step will turn the dashboard from a simple clock into something truly useful: displaying data like weather forecasts, to-do lists or calendar events.
Part 1: Hardware setup and first clock
Part 2: Refresh strategy, testing and logging
Part 3: External API integration (this post)
Architecture
So far, we have a function to display the content as an image and render it with the Waveshare Python library on the e-ink display. But showing just a date and time is not the end goal - we want to build a dashboard after all!
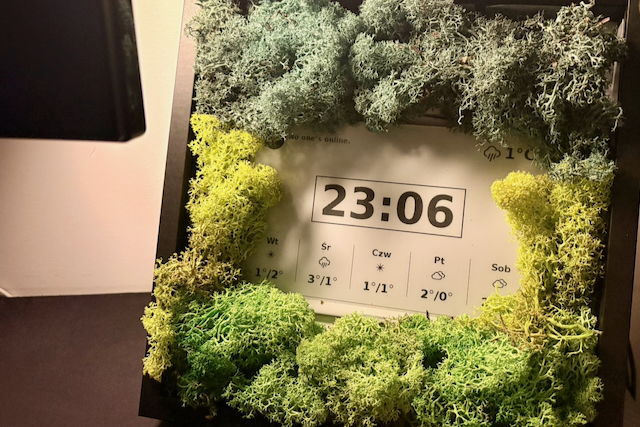
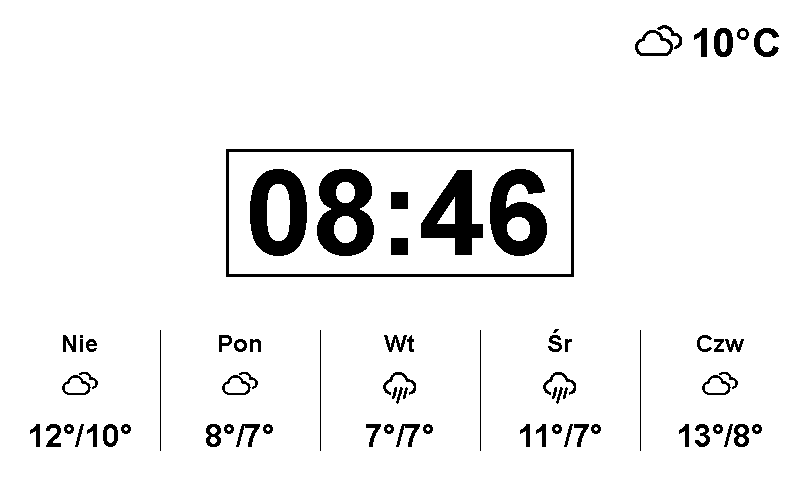
Let’s add the first external integration: displaying current weather and weather forecast. Expected outcome: current weather in the top right corner, forecast at the bottom.
To achieve that, we need to fetch the data from the external resource and display it on the rendered image. How can we design the solution around it?
There are two separate responsibilities:
- making the call to the API to fetch the data
- display the data on the dashboard.
Therefore, our solution will consist of two parts. We will build a service that makes an API call and saves results to a file (JSON or txt). Then, a new function will read the file and render its content. Separating those two concerns not only makes development easier but also simplifies testing this feature.
But before we make the first API call, let’s set up a clean way to store the API keys we’ll need.
Handling environment variables
Every external API we integrate with needs a token or key, which needs to be secured (never exposed in codebase or git history). The simple approach is to keep them in a .env file in the project root and load them at runtime.
First, create the .env file and add it to .gitignore so it’s never committed:
OPEN_WEATHER_API_KEY=your_token_here
GITHUB_TOKEN=your_token_here
STEAM_API_KEY=your_token_here
Then use the python-dotenv package to load the file into the environment at the top of each service:
from dotenv import load_dotenv
import os

load_dotenv()
api_key = os.getenv('OPEN_WEATHER_API_KEY')
We’ll follow this same pattern for every integration.
Calling the weather API
We can use OpenWeather API, as the free tier should be enough for our needs. Register on the page, create an API token and read the docs to decide which API endpoints we should use. Looks like data/2.5/forecast endpoint should be good - it returns weather data for the next 5 days in blocks of 3 hours. We can make just one API call for the current weather and the forecast.
# services/fetch_weather.py

import requests
import json
import os
import sys
from datetime import datetime, timedelta
from collections import defaultdict
from dotenv import load_dotenv

load_dotenv()

def fetch_weather():
    api_key = os.getenv('OPEN_WEATHER_API_KEY')
    if not api_key:
        raise ValueError("OPEN_WEATHER_API_KEY environment variable not set")

    # "Warsaw,PL"
    lon = 21.017532
    lat = 52.237049

    url = f"https://api.openweathermap.org/data/2.5/forecast?lon={lon}&lat={lat}&appid={api_key}&units=metric&lang=pl"

    response = requests.get(url)
    response.raise_for_status()  # Raise error for bad status codes

    data = response.json()

    forecast_list = data.get('list', [])
    if not forecast_list:
        raise ValueError("No forecast data")

    # Treat first item as current weather
    first = forecast_list[0]
    current = {
        "temp": round(first['main']['temp']),
        "description": first['weather'][0]['description'],
        "icon": first['weather'][0]['icon']
    }

    # Process forecast for midday and midnight
    grouped = defaultdict(dict)
    for item in forecast_list:
        dt = datetime.fromisoformat(item['dt_txt'])
        date_str = dt.date().isoformat()
        hour = dt.hour
        if hour == 15:  # Midday
            grouped[date_str]['midday'] = {
                'temp': round(item['main']['temp']),
                'icon': item['weather'][0]['icon']
            }
        elif hour == 3:  # usually the coolest time
            grouped[date_str]['midnight'] = {
                'temp': round(item['main']['temp']),
                'icon': item['weather'][0]['icon']
            }

    # Build forecast for next 5 days
    forecast = []
    today = datetime.now().date()
    for i in range(1, 6):  # Days 1-5
        target_date = (today + timedelta(days=i)).isoformat()
        if target_date in grouped and 'midday' in grouped[target_date] and 'midnight' in grouped[target_date]:
            forecast.append({
                'date': target_date,
                'midday': grouped[target_date]['midday'],
                'midnight': grouped[target_date]['midnight']
            })

    weather_info = {
        'current': current,
        'forecast': forecast
    }

    script_dir = os.path.dirname(os.path.abspath(__file__))
    data_file = os.path.join(script_dir, '..', 'data', 'weather.json')
    with open(data_file, 'w') as f:
        json.dump(weather_info, f, indent=2)

try:
    fetch_weather()
except Exception as e:
    print(f"[ERROR] {e}")
    sys.exit(1)
OpenWeather API returns weather forecast for 3-hour blocks for the next 5 days, but our dashboard doesn’t need such detailed data. Therefore, we aggregate them: for each date, we just want to have the temperature in the middle of the day and at midnight.
The function saves results in the /data/weather.json - example output file looks like:
{
  "current": {
    "temp": 10,
    "description": "zachmurzenie",
    "icon": "03n"
  },
  "forecast": [
    {
      "date": "2025-10-26",
      "midday": {
        "temp": 12,
        "icon": "04d"
      },
      "midnight": {
        "temp": 10,
        "icon": "10n"
      }
    },
    {
      "date": "2025-10-27",
      "midday": {
        "temp": 8,
        "icon": "04d"
      },
      "midnight": {
        "temp": 7,
        "icon": "10n"
      }
    }
  ]
}
The forecast array continues for the remaining days in the same shape.
It’s easy to test: invoke the Python script and verify if the JSON file is created.
Now we need to automate running this script. We already know systemd from the previous parts, but there’s a difference: the clock service runs continuously, while the weather fetch script runs once and exits. For periodic jobs like this, the right tool is a systemd timer paired with an oneshot service.
First, the service - note Type=oneshot, since the script just runs and quits (fetch_weather.service):
[Unit]
Description=Fetch weather data for E-Ink dashboard
After=network-online.target
Wants=network-online.target

[Service]
Type=oneshot
ExecStart=/usr/bin/python3 /home/pi/eink/services/fetch_weather.py
WorkingDirectory=/home/pi/eink
User=pi
Then the timer that triggers it. Frequency can be adjusted, let’s keep it every 3 hours, for example (fetch_weather.timer):
[Unit]
Description=Run weather fetch every 3 hours

[Timer]
OnBootSec=1min
OnUnitActiveSec=3h
Persistent=true

[Install]
WantedBy=timers.target
Enable the timer (not the service), so it starts on boot:
sudo systemctl enable --now fetch_weather.timer
As the final test, trigger the service once manually and verify that the output file is created:
sudo systemctl start fetch_weather.service
cat /home/pi/eink/data/weather.json
Displaying weather
Now it’s time to extend the dashboard rendering function to also draw weather data. Since we read the JSON data from the file, we can test drawing with dummy data, without doing any API calls.
As you noticed, openWeather returns not only degrees and description, but also a weather icon. Let’s use that to make the weather look more appealing. There are a lot of free weather icon sets. Let’s pick one and create a mapping between API icon names and actual images to render. It can look like:
weather_icon_mapping = {
    "01d": "wi-day-sunny-big.png",      # clear sky day
    "01n": "wi-day-sunny-big.png",      # clear sky night (fallback to day)
    "02d": "wi-day-cloudy-big.png",     # few clouds day
    "02n": "wi-day-cloudy-big.png",     # few clouds night
    "03d": "wi-cloudy-big.png",         # scattered clouds
    "03n": "wi-cloudy-big.png",
    "04d": "wi-cloudy-big.png",         # broken clouds
    "04n": "wi-cloudy-big.png",
    "09d": "wi-showers-big.png",        # shower rain
    "09n": "wi-showers-big.png",
    "10d": "wi-rain-big.png",           # rain
    "10n": "wi-rain-big.png",
    "11d": "wi-storm-showers-big.png",  # thunderstorm
    "11n": "wi-storm-showers-big.png",
    "13d": "wi-snowflake-cold-big.png", # snow
    "13n": "wi-snowflake-cold-big.png",
    "50d": "wi-fog-big.png",            # mist
    "50n": "wi-fog-big.png"
}
And the function to draw the weather data:
def draw_weather_info(image, full_width, full_height, font):
    # Load weather data
    with open('data/weather.json', 'r') as f:
        weather = json.load(f)

    current = weather['current']
    forecast = weather['forecast']

    # Draw current weather (top right)
    temp_text = f"{current['temp']}°C"
    icon_code = current['icon']
    icon_file = weather_icon_mapping.get(icon_code, 'wi-alien-big.png')
    icon_path = os.path.join('assets', 'weather', icon_file)
    icon_img = Image.open(icon_path).convert('RGBA')
    bg = Image.new('RGBA', icon_img.size, (255, 255, 255, 255))
    bg.paste(icon_img, (0, 0), icon_img)
    icon_img = bg.convert('1')
    icon_size = 64
    icon_img = icon_img.resize((icon_size, icon_size), Image.Resampling.LANCZOS)

    draw = ImageDraw.Draw(image)
    font_small = ImageFont.truetype(font, 40)

    temp_bbox = draw.textbbox((0, 0), temp_text, font=font_small)
    temp_w = temp_bbox[2] - temp_bbox[0]
    total_w = icon_size + 10 + temp_w
    x_start = full_width - total_w - 20
    icon_x = x_start + 10
    temp_x = x_start + icon_size + 10
    temp_y = 20
    text_center_y = temp_y + (temp_bbox[1] + temp_bbox[3]) / 2
    icon_y = int(text_center_y - icon_size / 2)
    image.paste(icon_img, (icon_x, icon_y))
    draw.text((temp_x, temp_y), temp_text, font=font_small, fill=0)

    # Draw forecast (centered at bottom)
    forecast_y = full_height - 150
    icon_size = 48
    font_day = ImageFont.truetype(font, 24)
    font_temp = ImageFont.truetype(font, 32)
    item_width = 100
    total_width = len(forecast) * item_width + (len(forecast) - 1) * 60
    start_x = (full_width - total_width) // 2
    x = start_x

    for i, day in enumerate(forecast):
        day_of_week = datetime.fromisoformat(day['date']).strftime('%a')
        day_pl = day_mapping.get(day_of_week, day_of_week)
        # Day text
        day_bbox = draw.textbbox((0, 0), day_pl, font=font_day)
        day_w = day_bbox[2] - day_bbox[0]
        day_x = x + (item_width - day_w) // 2
        draw.text((day_x, forecast_y), day_pl, font=font_day, fill=0)
        # Icon
        icon_code = day['midday']['icon']
        # Draw alien if no icon is found
        icon_file = weather_icon_mapping.get(icon_code, 'wi-alien-big.png')
        icon_path = os.path.join('assets', 'weather', icon_file)
        icon_img = Image.open(icon_path).convert('RGBA')
        bg = Image.new('RGBA', icon_img.size, (255, 255, 255, 255))
        bg.paste(icon_img, (0, 0), icon_img)
        icon_img = bg.convert('1')
        icon_img = icon_img.resize((icon_size, icon_size), Image.Resampling.LANCZOS)
        icon_x = x + (item_width - icon_size) // 2
        icon_y = forecast_y + 30
        image.paste(icon_img, (icon_x, icon_y))
        # Temperature
        temp_text = f"{day['midday']['temp']}°/{day['midnight']['temp']}°"
        temp_bbox = draw.textbbox((0, 0), temp_text, font=font_temp)
        temp_w = temp_bbox[2] - temp_bbox[0]
        temp_x = x + (item_width - temp_w) // 2
        temp_y = icon_y + icon_size + 10
        draw.text((temp_x, temp_y), temp_text, font=font_temp, fill=0)
        # Draw vertical line between entries (except after last)
        if i < len(forecast) - 1:
            line_x = x + item_width + 30
            draw.line([line_x, forecast_y, line_x, forecast_y + 120], fill=0, width=1)
        x += item_width + 60
The function draws the current weather in the top right corner: the number and the weather icon. Then, it iterates through items found in the "forecast" Array from the data file to draw the weather forecast for the next few days. It’s positioned at the bottom of the dashboard, with vertical lines separating each day.
One e-ink-specific detail worth highlighting is how the icons are loaded. The display is 1-bit (every pixel is either black or white), so we can’t just paste a PNG with transparency onto it. Instead, we flatten each icon onto a white background and convert it to 1-bit mode before drawing:
icon_img = Image.open(icon_path).convert('RGBA')
bg = Image.new('RGBA', icon_img.size, (255, 255, 255, 255))
bg.paste(icon_img, (0, 0), icon_img)   # composite using the alpha channel
icon_img = bg.convert('1')             # 1-bit: black or white only
Without this step, transparent areas would render as black blobs on the panel.
Finally, we plug the new function into the render loop from the previous parts - right after drawing the date and time:
image = drawing.draw_date_and_time(epd.width, epd.height, font)
drawing.draw_weather_info(image, epd.width, epd.height, font)
buf = epd.getbuffer(image)
# ... full / partial refresh as before
Bonus: more integrations
In my personal dashboard, I reuse this same fetch → display pattern twice more: the GitHub API to display the list of PRs I need to check, and the Steam API to display the status of my friends (both included in the gist below).
One tweak I found very helpful is to make the dashboard’s content depend on the time of day. During work hours, dashboards display info about PRs from GitHub; after hours, it renders my friends’ Steam status. This information is positioned in the top left corner, so I have a simple dispatcher to decide which function to render:
def draw_steam_or_github(image, font):
    now = datetime.now()
    is_weekday = now.weekday() < 5
    is_work_time = 7 <= now.hour < 18  # between 07:00 and 18:00

    if is_work_time and is_weekday:
        draw_github_info(image, font)
    else:
        draw_steam_friends(image, font)
You can find full code examples in the GitHub Gist or in the complete waveshare-eink repo.
Wrapping up the series
This was the final part of the e-ink dashboard series. Looking back at the whole journey:
- Part 1 - we connected the e-ink display to a Raspberry Pi, set up the environment, and rendered a first clock.
- Part 2 - we made the refresh reliable: a partial/full refresh strategy that respects the panel’s limits, plus testing and logging.
- Part 3 - we turned the clock into a real dashboard by integrating external APIs.
The result is a low-power, always-on display on my desk that shows exactly the information I care about. More importantly, the fetch → display pattern allows adding new integrations very easily. Calendar events, to-do lists, home automation status - whatever is useful - requires just a small service writing a file and a function to draw it.
The full source code of the project is available in the waveshare-eink repo.